- MP
- Blog
- Risk Management
- 5 Key Elements of Risk Management
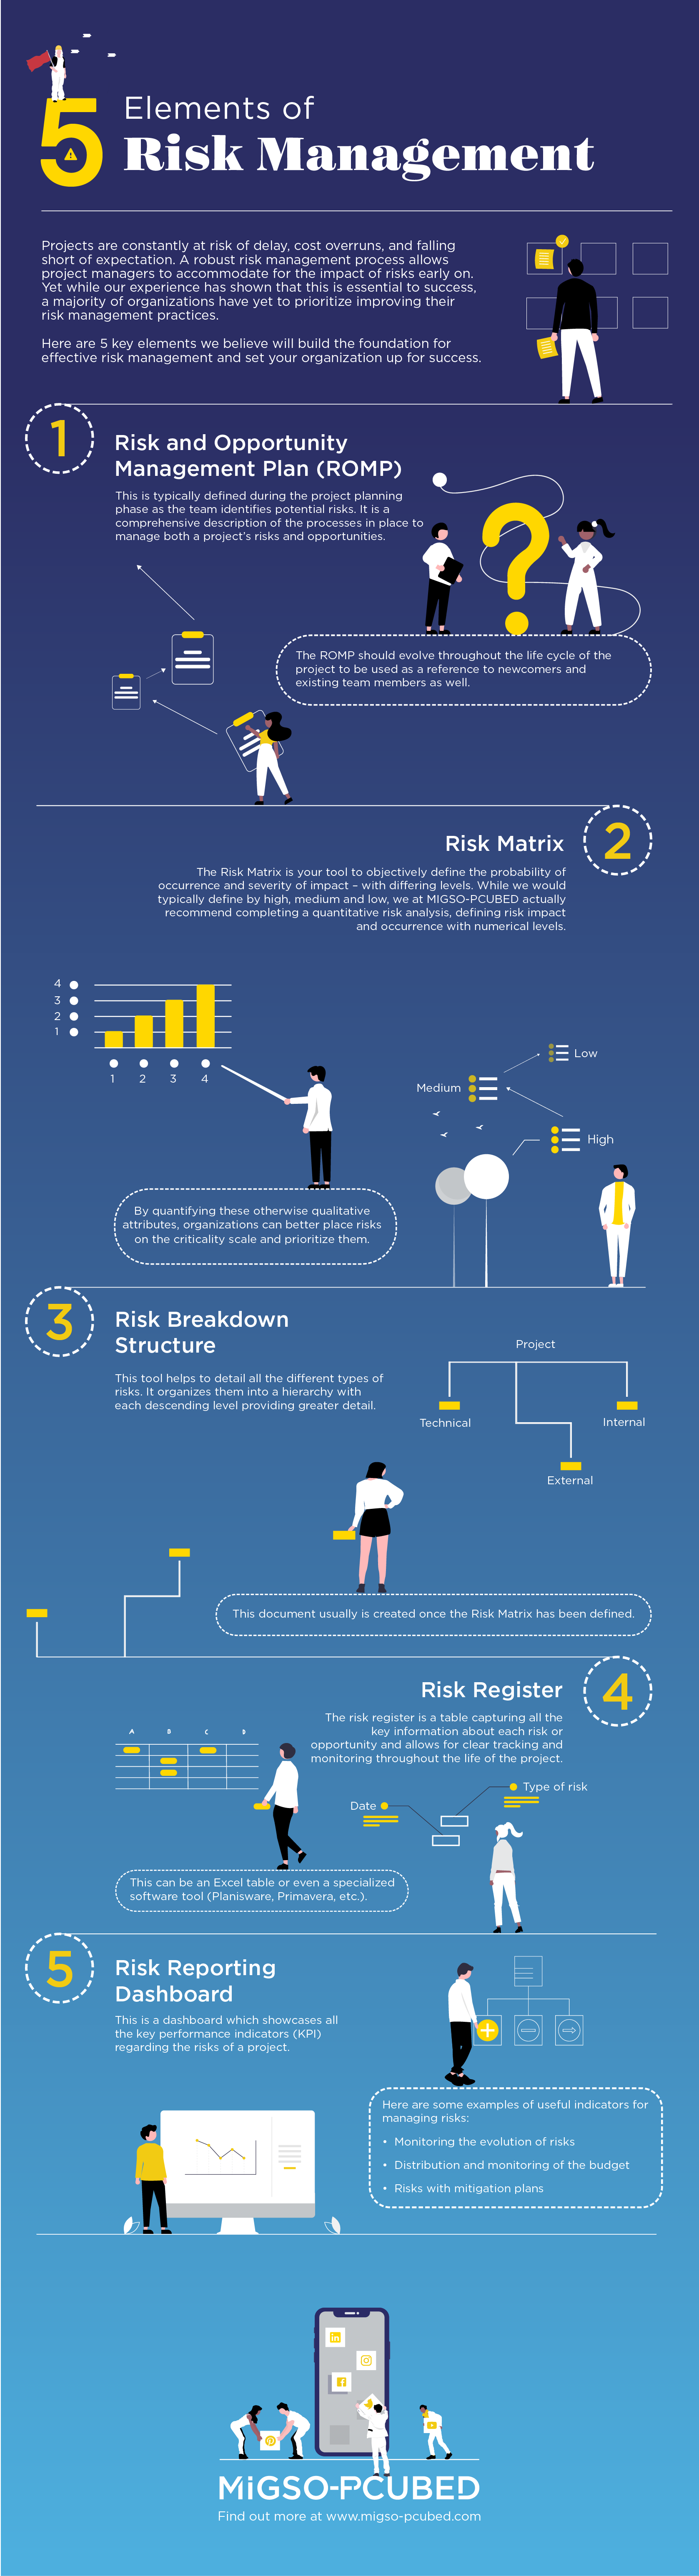
There are several key elements necessary for implementing project risk management into your organization. Together, these build the foundation for effective risk management and set your organization up for success. In this article, we guide you through the practical aspects of integrating risk management into your organization, starting with 5 key components.
1. Risk and Opportunity Management Plan
A risk management strategy should be defined during the project planning phase while drafting the Project Management Plan. In fact, when launching the project, it is possible for the project team to identify a large number of potential risks, depending on your risk culture. The Project Management Plan consists of several parts, including the Risk Management Plan.
A Risk and Opportunity Management Plan, or ROMP, is a comprehensive description of the processes in place to manage a project’s Risks and Opportunities (R&O). It includes the role of various project stakeholders, steering, and decision-making bodies; the tools used; what reporting is planned; etc.
The ROMP should evolve throughout the life cycle of the project, as it will be used as a reference for the project. Newcomers to the project as well as existing team members can refer to it to understand the operating model and raise questions they may have.
For the ROMP to be relevant, the project must first have:
- Clearly defined objectives,
- An identified master schedule, as well as
- A preliminary cost estimate for completion.
These elements will then make it possible to define the different levels of risk based on clear criteria. It is best to start with defining a risk matrix (or a risk assessment matrix). This tool, explained in more detail below, allows risks and opportunities to be assessed objectively and consistently. The impact criteria are then based on the objectives of the project; the most common of which are cost, time, and quality.
2. Risk Matrix
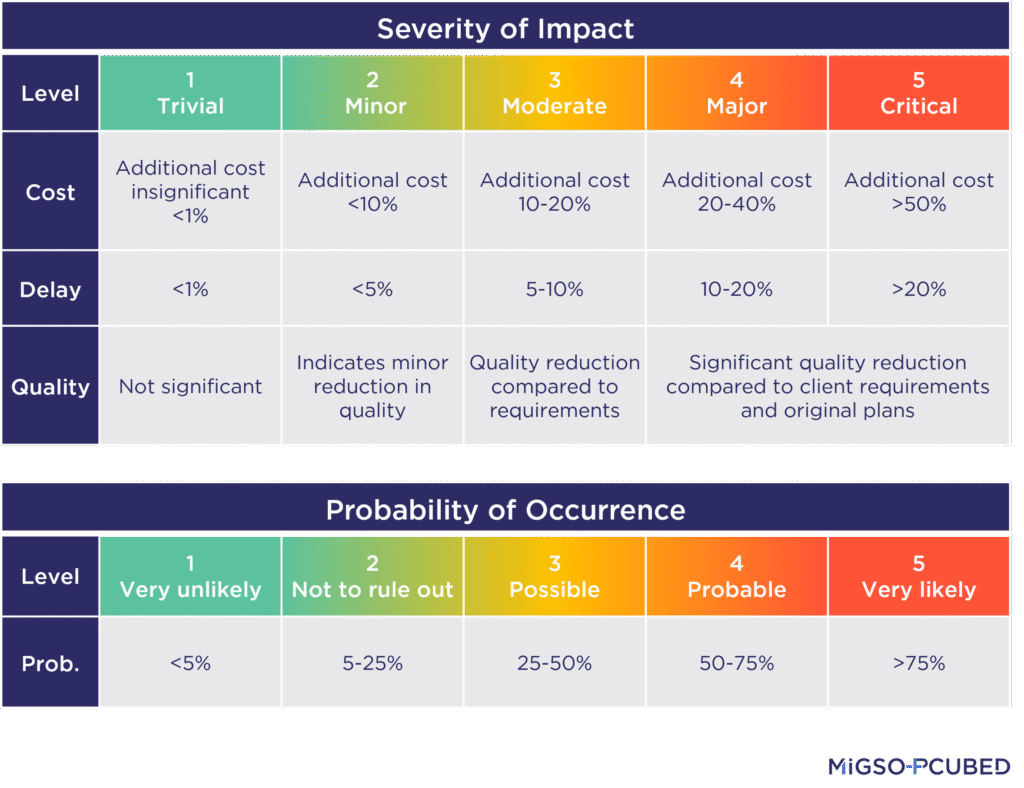
The Risk Matrix must objectively define each criterion – probability of occurrence and severity of impact – with differing levels. While risk impact is typically qualified by high, medium, and low, we at MIGSO-PCUBED recommend completing a quantitative risk analysis, defining risk impact and occurrence with numerical levels.
By quantifying these otherwise qualitative attributes to risks and opportunities, organizations can better place risks on the criticality scale and prioritize them. This also allows for more flexibility in visualizing risks on your risk reporting dashboard.

When assessing the cost impact, for example, it is common to use % of cost at completion. In this case, an organization would define severity based how much additional cost the risk would cause as a percent of cost completion. To determine the severity of a risk’s impact to the timeline or schedule, on the other hand, it is helpful to use the ability to achieve milestones.
Regarding the probability of risks occurring, conventional percentages (such as 5%, 25%, 50% or 75%) can be used. Although, associating words with these probabilities often helps managers because a number alone could be too abstract. For example: 5% very unlikely, 25% not to be ruled out, or 75% quite likely. Alternatively, using numbers based on chance, such as a 1 in 2 chance, could be helpful.
Note: Be careful! Depending on the company, the meaning of their scale may vary: 1 could either represent the least serious impact and probability because it is very small, or 1 could represent the most important/severe level because it has a priority #1. So be cautious and remember to refer to the ROMP as well as the defined risk matrix to know what situation you are in!
A risk matrix can have several configurations:
- 4 x 4: 4 levels of impact and 4 levels of probability. This is ideal since there is no “neutral” option.
- 4 x 5: 4 levels of impact and 5 levels of probability. This is sometimes useful for a greater scale of probability and/or to estimate by chance (1 in 2 chances).
- 5 x 5: 5 levels of impact and 5 levels of probability.
3. Risk Breakdown Structure
Once the risk matrix has been defined, it is interesting to think about the characteristics of risks and opportunities: what types of risk will be present in the project?
To achieve this, the Risk Breakdown Structure, commonly called RBS, is used. This is a document listing all the different types of risks and opportunities possible. It organizes them into a hierarchy with each descending level providing greater detail.
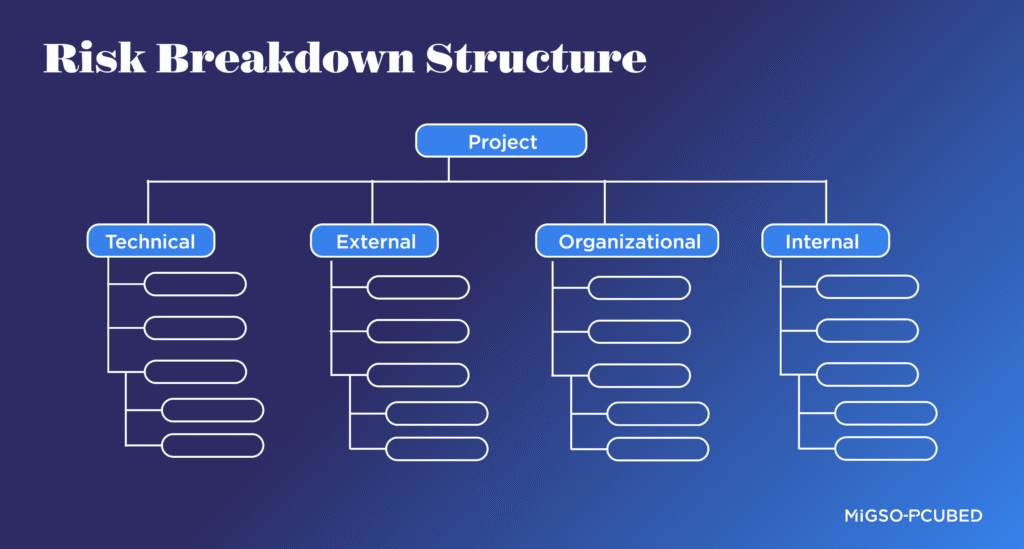
This document is useful for two reasons:
- First to guide risk identification, the RBS gives a framework to follow and prevents missing any important risks.
- It also allows for identified risks to be categorized during analysis and reporting, which helps in identifying the root causes of the risk.
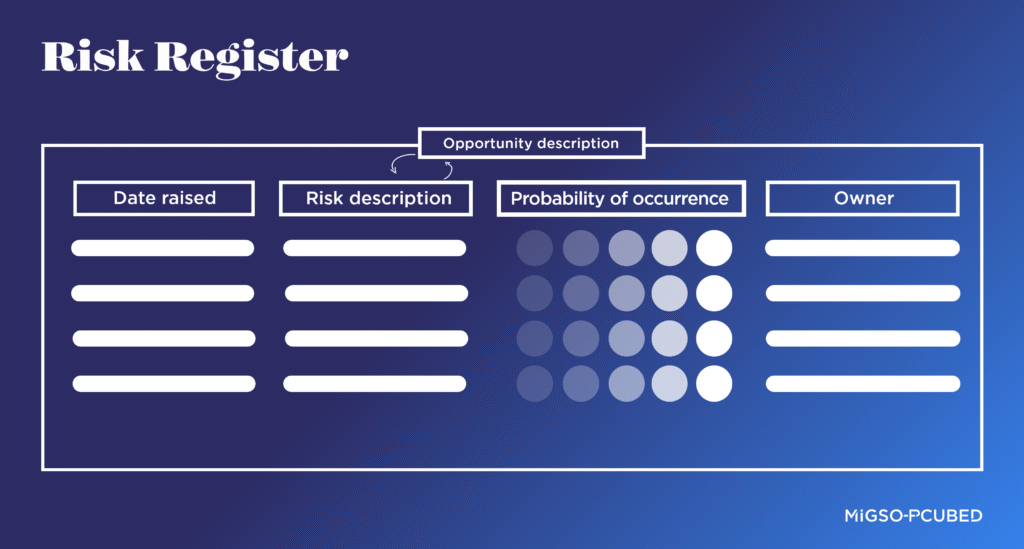
4. Risk Register
Once the risk matrix has been defined and the RBS validated, the Risk and Opportunity Register must be set up. The risk register is a table capturing all the key information about each risk or opportunity. This can be an Excel table or even a specialized software tool (Planisware, Primavera, etc.).
5. Risk Reporting Dashboard
In order to best manage project risks, a dashboard with relevant indicators is critical. Here are some examples of useful indicators for managing risks:
- A heat matrix: to visualize the distribution of risks in relation to their criticality
- The distribution of major/medium/minor risks by number: simple and effective indicators allow for a global vision of the project
- Risks by business case or work package: allows for an understanding of the distribution of project risks and also ensures that the process has been defined for all the project work packages
- Monitoring the evolution of risks: stable, improvement, degradation, resolved, new: allows for the monitoring of the risk management process
- Distribution and monitoring of the budget: provides an overall view of the project budget and the ability to identify the work package / area containing the greatest financial risks.
- Risks with mitigation plans
- Late actions for mitigation
- Delayed risks in review
In Summary
Thank you for the contributions of Marie BELGODERE, Jérémie CLAUSTRE, Capucine COMTE, Alioune DIALLO, Emmanuel LATGE, Jessy MIGNOT, Ingrid NGOBAY, Pierre PETILLON, Louann SUGDEN, Chris WAMAL, and the MIGSO-PCUBED Risk Management Community of Practice.