- MP
- Blog
- Schedule Management
- Transform a schedule into a reliable management tool with EVM
Every project manager or PMO has experienced this frustrating situation: The dashboards show positive results, the progress reports are optimistic, and the costs are in line with forecasts. Yet a persistent intuition suggests that the project is drifting off course. In reality, this mirage of traditional monitoring is nothing more than the ticking of a time bomb.
The project’s KPIs might appear green: the schedule, costs and scope all suggest that the project is progressing smoothly. However, this illusion of control masks potentially growing tensions which, in the long term, will inevitably lead to major budget and schedule overruns if unaddressed. And when reality finally emerges, what appeared to be a well-managed project turns into an emergency mobilization to contain the impact and try to get it back on track.
Faced with this situation, one method stands out as a solution: Earned Value Management (EVM). By inherently integrating scope, schedules and costs, EVM provides a three-dimensional and objective view of the project's actual performance. It not only indicates whether there is a delay or whether the budget has been exceeded, but also reveals whether the value of the work accomplished corresponds to what was planned and spent.
However, the reliability of EVM depends entirely on the rigor of the schedule, cost tracking, and scope on which it is based. EVM indicators, even if mathematically accurate, are misleading if based on unrealistic or poorly structured scheduling. A schedule that is not optimized for realistic performance measurement is a poor tool: it is like a GPS that shows your position to the nearest centimeter on the wrong map.
This article reveals the fundamental pillars and step-by-step method for developing a robust project schedule optimized for EVM. By mastering these principles, project monitoring is transformed into realistic and proactive management.
Read also:
The article What is EVM (Earned Value Management) and how can it be used? explains the definitions of the EVM formulas and terms used in this article.
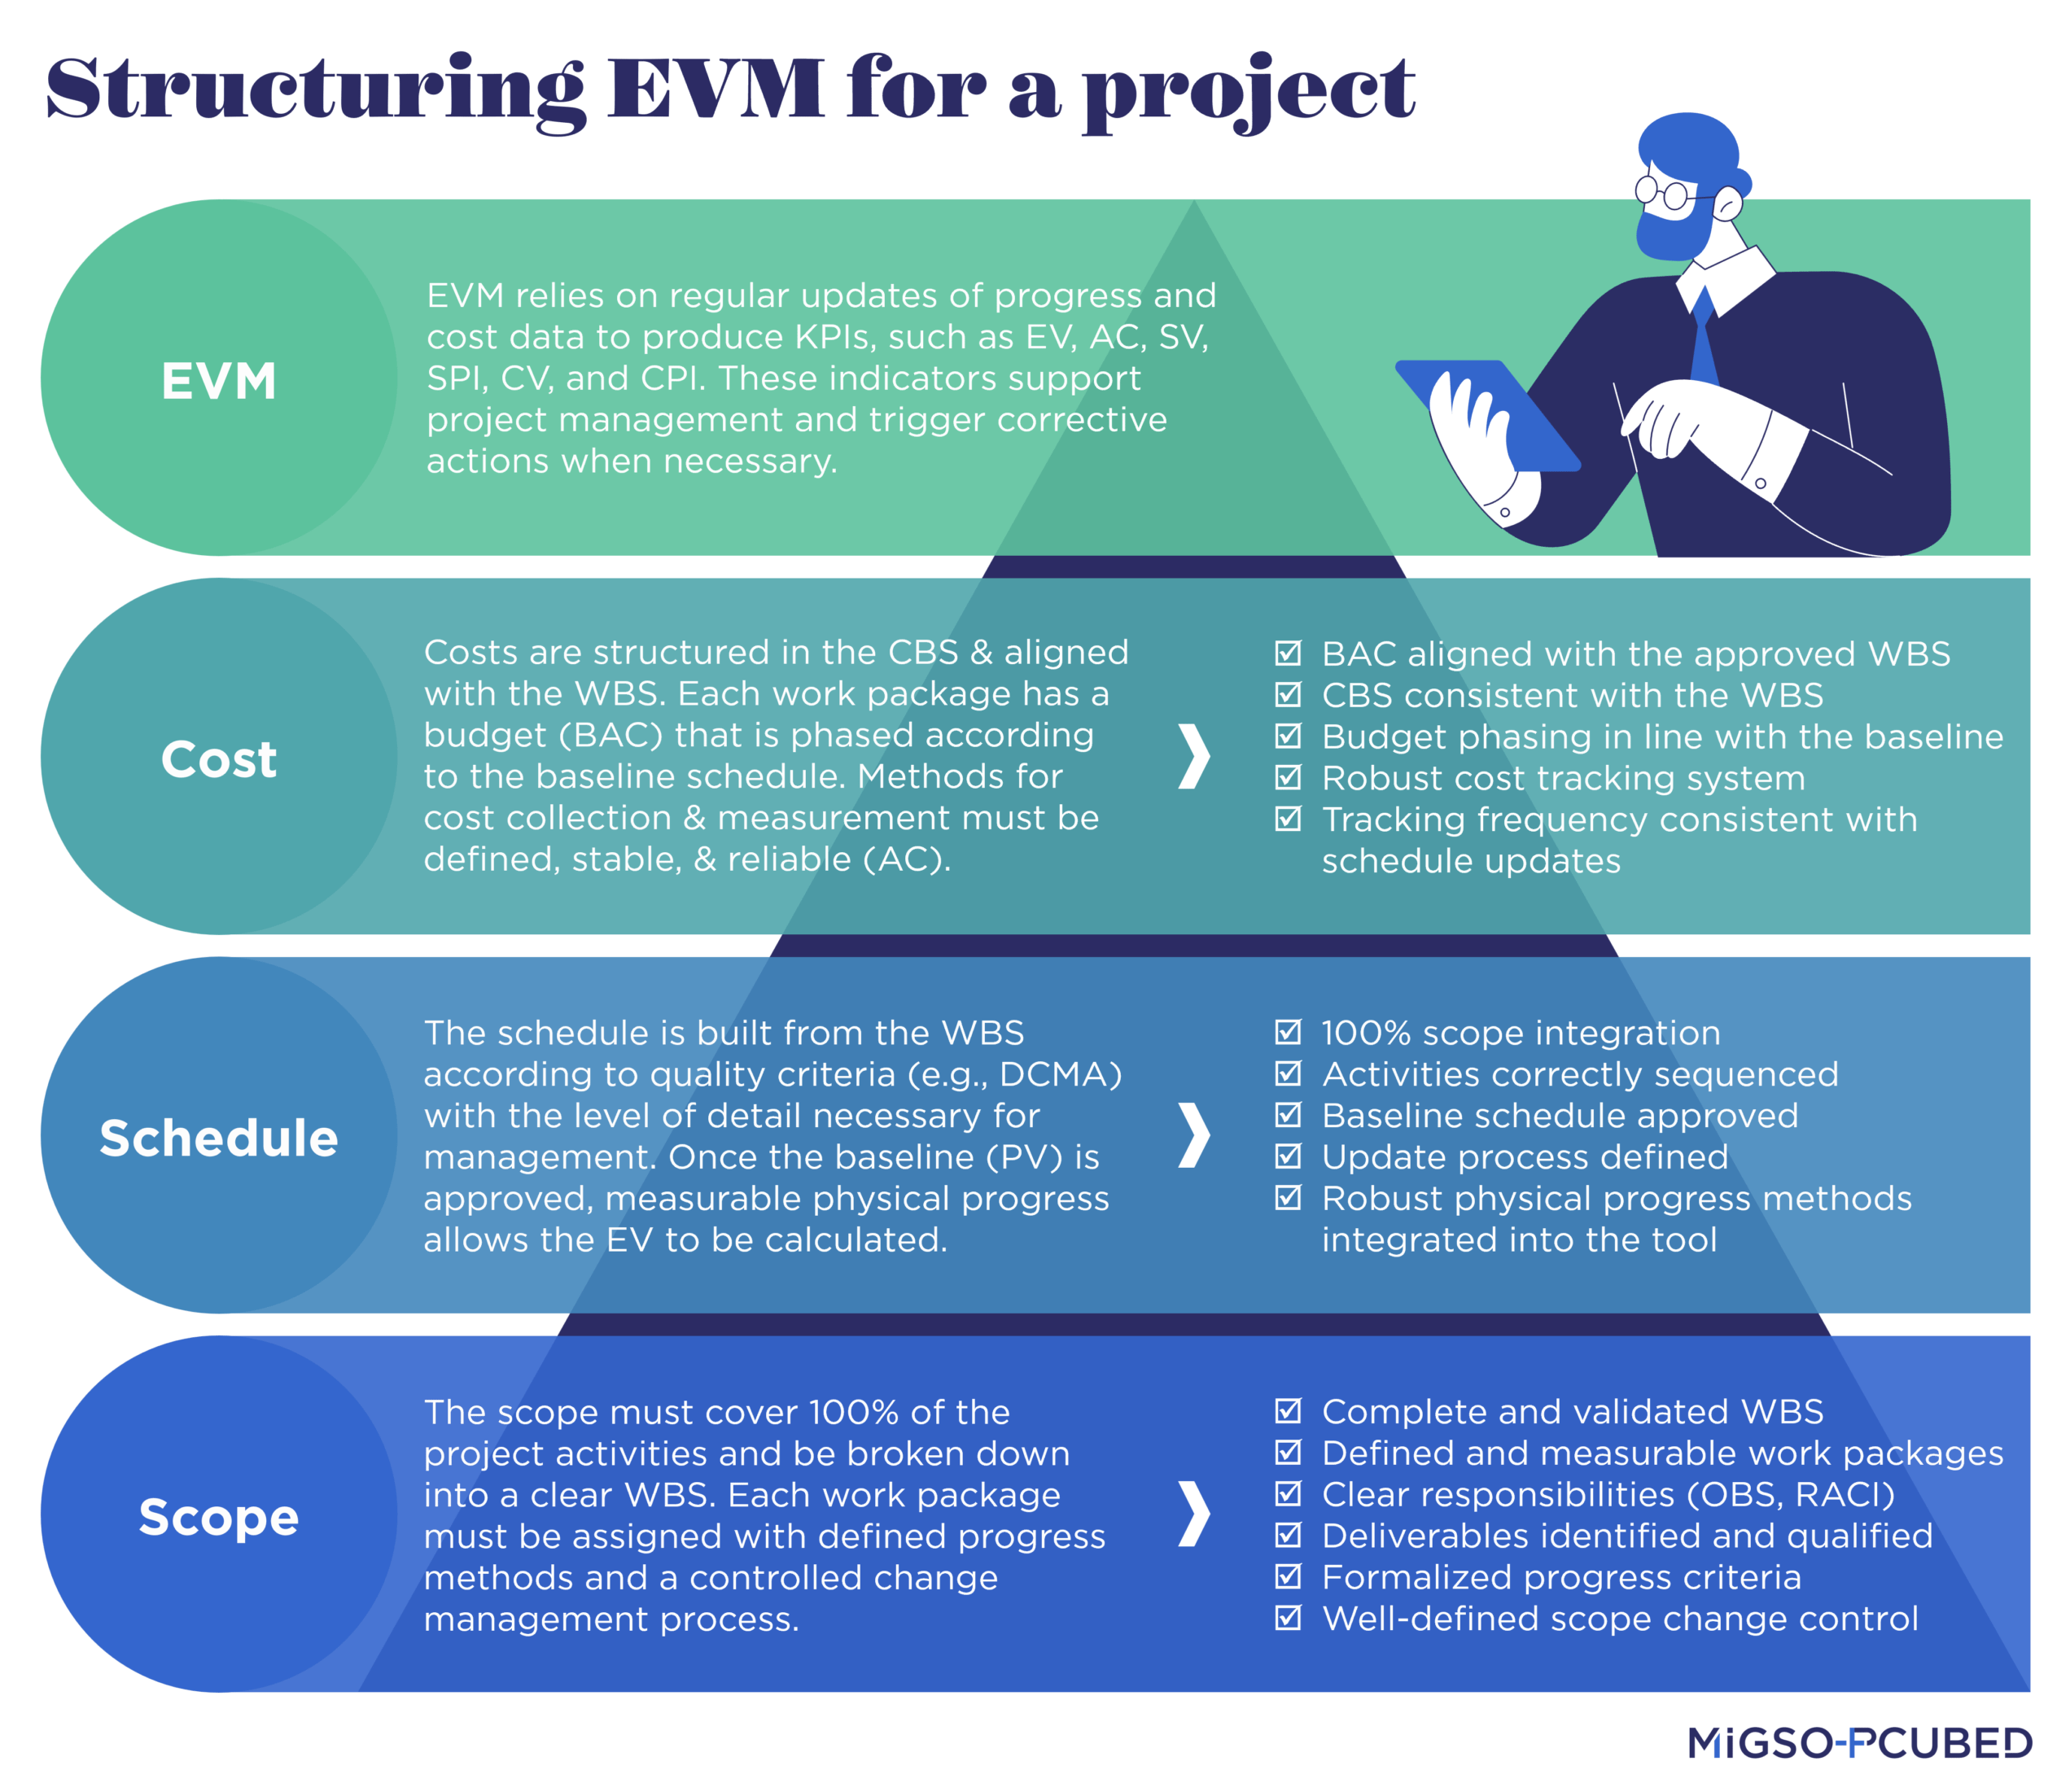
The Pillars of Reliable Scheduling for EVM
The following pillars are not isolated steps, but rather interdependent components of a robust management system. If even one fails, the entire earned value analysis becomes unreliable.
Pillar #1: The WBS, Your Project's Genetic Map
The major challenge many projects face is the confusion between a list of activities (the “how”) and a Work Breakdown Structure (WBS), which should be a hierarchical breakdown of deliverables (the “what”). This design flaw creates a major dissonance between scope, schedule and costs, thereby undermining the reliability of EVM analyses.
To illustrate this distinction, let's use the analogy of making a lemon meringue pie:
- The main deliverable is the pie itself.
- The sub-deliverables are its components: the short-crust pastry, the lemon cream and the meringue.
- The activities are the actions: preheating the oven, mixing the eggs, etc.
The WBS should focus exclusively on the first two points: the “what”, not the “how”. It is the only structure that links the scope (the deliverables) to the schedule (when they will be completed). In practice, an activity-based WBS can lead to scope creep. Each new task may seem insignificant, but without associating it with a validated deliverable, you unintentionally dilute the scope.
The WBS structures and defines the entire contents of the project, ensuring that each work item is connected to a tangible result. If the structure is wrong, all analysis that follows will be skewed. This principle is guaranteed by the “100% rule,” which stipulates that each level of decomposition must contain 100% of the work of the parent level, ensuring that the WBS captures the entire scope of the project.
Pillar #2: PMB, the Point of Convergence between Scope, Timeline and Cost
The Performance Measurement Baseline (PMB) incorporates all three fundamental benchmarks of the project: scope, timeline and cost. It is the official project plan, a budget plan spread out over time that will serve as a benchmark for evaluating performance within the previously established and validated scope.
This fusion of the three critical dimensions of the project is the crucial step in obtaining a consistent planned value (PV) curve. This curve represents the value of the work that should be accomplished at any point in the project and forms the basis for any earned value analysis.
One critical point must be emphasized: to be realistic, the PMB should incorporate resource constraints. A schedule that ignores the actual availability of teams, key skills or equipment is not a plan, it is a “wish list”.
This rigor is essential because the PMB is the budgetary reference for your project. If your Gantt chart plans to complete a testing phase in three weeks when the database expert is unavailable, your planned value (PV) will be structurally incorrect.
Integrating resources from the outset of the PMB is a way to ensure the reliability of your performance indicators:
- A solid basis for calculation: Without precisely allocated resources, the calculation of Earned Value (EV) is skewed from the beginning.
- Detecting variances: If the PMB is underestimated due to a lack of realism, cost variances (CV) and schedule variances (SV) will occur, reflecting not poor execution but flawed initial schedule.
- A strategic vision: The PMB forces an honest conversation about actual production capabilities before problems arise.
By aligning resources with the budget and schedule, what would have been a ‘budget excuse’ is transformed into a measurable and manageable strategic planning decision.
EVM Tip:
Although Earned Value Management (EVM) can be used to measure schedule variance (SV) and cost variance (CV) in monetary terms, ration-based performance indices are essential for validating the reliability of each scheduling pillar. The SPI (Schedule Performance Index), in particular, is used to test the reliability of the PMB. An SPI of less than 1 indicates a delay in relation to the baseline schedule. If this ratio begins deviating early in the project, it is likely that the PMB did not sufficiently account for actual resource constraints or logical dependencies.
Pillar #3: Estimation, the Art of Realistic Forecasting
The PMB’s reliability depends entirely on the quality of the duration and cost estimates of which it is comprised. To establish credible forecasts and avoid overly optimistic schedules, it is necessary to use rigorous techniques:
- Bottom-up estimation: Recognized as the most accurate method, this involves estimating the cost and duration of work packages at the lowest level of the WBS by weighing the types of activities, either according to the granularity known at that stage of the project or based on feedback from other projects. Then these estimates are aggregated to obtain the total for the project. However, this estimate requires a detailed and well-structured work breakdown structure (WBS), time to aggregate the data, high-quality data, and a consistent bottom-up and top-down development process.
- Three-point estimation (PERT): This method manages uncertainty by using three estimates for each activity: optimistic (O), most likely (ML) and pessimistic (P). A more realistic weighted estimate is then calculated using the following formula: E = (O + 4ML + P) /6.
- Rolling wave planning: This pragmatic approach involves planning short-term work in detail while maintaining flexibility for longer-term work. As the project progresses, future work packages are broken down into finer detail.
The choice between these methods is not insignificant and reflects the degree of maturity in project management. For example, bottom-up estimation is the gold standard in terms of accuracy, but it comes at a cost: time. It is, therefore, unsuitable in the preliminary design phase. On the contrary, rolling wave planning is a more pragmatic approach that concentrates the estimation effort where visibility is greatest, accepting the uncertainty of the future.
EVM Tip:
The CPI (Cost Performance Index) can also be used to evaluate estimates. If a structural CPI < 1 (overspending) is observed, this often indicates that the upward estimate was too optimistic or that the granularity of the work packages was insufficient when the data was aggregated. A low CPI is a warning sign that your reference budget was not realistic from the beginning.
Joint analysis of the SPI (Schedule Performance Index) and CPI (Cost Performance Index) allows you to move from simple observation to proactive management. For example, an SPI > 1 accompanied by a CPI < 1 may indicate that you are accelerating the project (ahead of schedule) but at the cost of major budgetary inefficiency (cost overruns).
Pillar #4: Progress Measurement, Avoiding the Subjectivity Trap
The golden rule is as follows: the technique for measuring the progress of each work package must be chosen and documented before work begins, usually in the “WBS dictionary”. This approach eliminates subjectivity and ensures a shared definition of how a task's status is measured (started, in progress, completed). Choosing a progress measurement technique is not just an operational decision, but it is also the engine that powers the calculation of Earned Value (EV). EV represents the budgeted cost of the work actually performed. The accuracy of this figure depends directly on the method chosen in the WBS dictionary.
The most objective and reliable measurement methods preferred are:
- The 0/100% rule: ideal for short tasks. Earned value is 0% until the work is completed, then it moves to 100% at the end.
- Incremental Milestones: for long tasks, this method assigns a percentage of the value to clear and verifiable intermediate milestones.
- Units Completed: this is the most objective method for repetitive work, as progress is a ratio between the actual quantity produced and the total quantity to be produced. This method allows for a pure mathematical calculation of EV. It is the purest correlation between finance and what is done in the field.
On the other hand, caution should be exercised when using Level of Effort (LOE). LOE is a measurement convention for ongoing support activities whose performance is evaluated based on time spent rather than the completion of concrete deliverables. Unlike a distinct work package, where value is acquired upon delivery of a product, the value of an LOE activity is accounted for simply by the passage of time.
This measurement method should be strictly reserved for tasks that do not directly result in a tangible product (e.g., administrative support, overall project management).
Management activities should not be confused with LOE. If a task produces distinct deliverables (e.g., a steering committee report or a risk management plan), it should not be classified as LOE, but rather measured using milestones or the 0/100 rule. LOE is an indicator of activity (presence) and not productivity (result).
Using LOE has structural limitations for project steering:
- Lack of calendar visibility: This method provides no real indication of whether deadlines are being met.
- Artificial synchronization: In a management system, the Planned Value (PV) of an LOE batch is automatically credited as Earned Value (EV) at the end of each period. This ensures perfect synchronization with the calendar but can mask actual inactivity.
- Cost variances (CV): Although the EV is synchronized with the PV, the Actual Cost (AC) usually differs, thus generating variances. It can even happen that earned value (EV) is accumulated without any actual cost (AC) if the planned work has not been carried out, which distorts the performance analysis.
Therefore, it is essential to limit the use of LOE as much as possible. For a more objective measurement, favor allocation methods or breakdown into distinct work packages whenever possible. LOE should only be used as a last resort for efforts that cannot be measured physically. This is why the total budget allocated to LOE tasks is limited to a maximum. In general, it is good practice not to exceed 5 to 10% of the total project budget, but in certain specific industrial projects, a maximum of 20% may be decided upon.
By documenting these methods upstream, you transform subjective progress into reliable financial data, enabling you to accurately calculate the variances and performance indicators (SV, CV, SPI, CPI) needed for management purposes.
Pillar #5: Steering, combining EVM and the critical path
EVM indicators, such as schedule variance (SV) or schedule performance index (SPI), are powerful quantitative alerts, but they are not enough on their own. An SPI of 0.85 indicates a 15% underperformance but does not automatically mean that the project will be delayed.
This is where critical path analysis comes in as an essential qualitative component. For example, an EVM report may show an SPI of 0.85, which is a red flag. A junior project manager might panic and mobilize resources. However, if critical path analysis reveals that the delayed tasks have a total margin of three weeks, then the real problem, hidden by the numbers, is a two-day micro-delay on a critical path task. EVM indicates that there is a problem, but the critical path indicates where it actually is.
Only the combination of EVM (quantitative alert) and critical path analysis (qualitative context) allows for flexible, realistic and focused deadline management. This shows that the EVM method is not a series of calculations, but an integrated management system.
Finally, controlling changes when necessary while following quantitative and qualitative analysis is not an administrative task. It is the mechanism that protects the integrity of the performance indicators. Without it, the Performance Measurement Reference deteriorates, rendering any performance measurement useless.
Tip - Projection at completion:
The ultimate benefit of an EVM-based management system is not just to look in the rear-view mirror, but to predict the project's outcome in advance. This is where the robustness of your Pillars 1, 2 & 3 comes into its own:
- Reliable EAC (Estimate At Completion): Projecting the final cost at completion should not be a simple mathematical rule of three. Based on a well-defined WBS and a controlled critical path, the PMO can determine whether the deviations observed (via the CPI) are atypical or structural.
- Resource anticipation: If your performance index indicates a delay, the structure of your schedule allows you to simulate rescheduling scenarios. Without a solid PMB (Performance Measurement Baseline), any end-of-project projection remains unreliable.
- Early warning indicator: Rigorous planning enables the To-Complete Performance Index (TCPI) to be calculated at an early stage, meaning the level of efficiency the team must achieve to remain within the original budget. If this ratio becomes unrealistic in light of past performance, it is a clear indication that renegotiation of the project scope or budget has become unavoidable.
Step-by-Step Method: The 9 Steps to Building Your Performance Measurement Baseline (PMB)
To achieve the best results, this section provides a sequential and concrete roadmap for implementing the pillars described above and building a robust PMB, ready for Earned Value Management.
- Break down the project scope: Create the Work Breakdown Structure (WBS) by focusing exclusively on the deliverables to be produced (the foundation of Pillar 1).
- Assign responsibility: Clearly define who is responsible for each work package identified in the WBS using a Responsibility Assignment Matrix (RAM).
- Develop the schedule: Schedule activities, define their logical dependencies, and integrate actual resource availability constraints (a prerequisite for Pillar 2).
- Establish the budget: Allocate budget to each work package in the WBS, based on rigorous estimates (the art of realistic forecasting in Pillar 3).
- Assign progress measurement types: For each work package, choose and document the most objective EVM measurement method (as detailed in Pillar 4), avoiding subjectivity.
- Define the benchmarks: Integrate the three benchmarks (scope, timeline, cost) to create a set baseline schedule (the setting point described in Pillar 2), which materializes the Planned Value (PV) curve.
- Report data: Rigorously collect actual physical progress (to calculate Earned Value, EV) and actual costs incurred (Actual Cost, AC) at a defined frequency.
- Analyze data: Calculate the EVM metrics and interpret them in conjunction with critical path analysis to assess the actual impact and determine the appropriate corrective actions (the synergy embodied in Pillar 5).
- Maintain references: Manage changes through a formal, controlled process so that any approved changes result in a documented update to the PMB, thereby protecting the integrity of the baseline.
Conclusion
The Earned Value method is much more than just a series of indicators: it is an integrated management system that requires unfailing rigor upstream. The pillars that have been explored are not an administrative constraint, but rather a strategic investment in the clarity and predictability of your project.
Implementing this robust structure transforms project monitoring into a truly proactive management tool capable of providing early and reliable warning signals. It allows you to react not to the surprise of a derailment, but to the first signs of a deviation.
In short, your schedule is not just a simple calendar; it is a dynamic model of the project's value creation. The real question is, therefore, does the schedule tell the truth or simply what we want to hear?
At MIGSO-PCUBED, we leverage our PMO expertise to support our clients in this robust planning process, ensuring a reliable view of their projects, integrated with the Earned Value method. Our goal is to optimize operational performance in terms of project management and control.
Thank you Roman Acevedo Dicillo and Elodie Blanchet, scheduling Subject Matter Experts, for contributing to this article.